Sentinel-2 Products
Sentinel-2 is a wide-swath, high-resolution, multi-spectral imaging mission, supporting Copernicus Land Monitoring studies, including the monitoring of vegetation, soil and water cover, as well as observation of inland waterways and coastal areas.
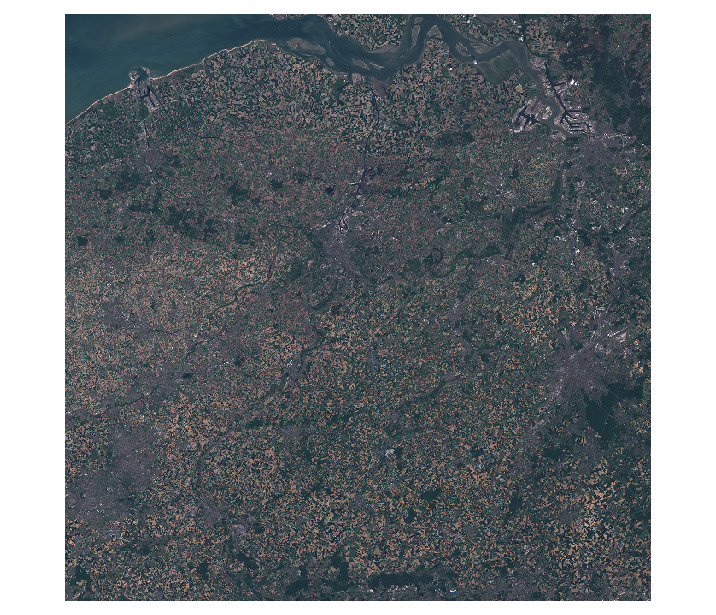
Terrascope provides Sentinel-2 Top-of-Atmosphere (TOA, Level-1C), Top-of-Canopy-(TOC, Level-2A) reflectance data, as well as value-added TOC biophysical indicators. An overview of the various data products is given below.
For both Level-1C and Level-2A, data are distributed in 100 \(\times\) 100 km2 tiles in Universal Transverse Mercator World Geodetic System 1984 (UTM/WGS84) projection with an overlap of 9.8 km between adjacent tiles. The tiling grid can be downloaded and additional information on the ESA Sentinel-2 data products and tiling strategy is available here.
Base products
Sentinel-2 Level-1C
The Sentinel-2 Level-1C MSI (MultiSpectral Instrument) product contains Top-of-atmosphere reflectances in cartographic geometry and are a compilation of elementary granules of fixed size (100x100km²), containing all possible spectral bands within a single orbit.
| Property | Value |
|---|---|
| Spatial extent | [-180, -84, 180, 84] |
| Temporal extent | 2015/06/23 - Current |
| DOI | 10.71570/j03h-7a16 |
Sentinel-2 Level-2A
The Sentinel-2 Level-2A MSI (MultiSpectral Instrument) product contains atmospherically corrected Surface Reflectances in cartographic geometry and are a compilation of elementary granules of fixed size (100x100km²), containing all possible spectral bands within a single orbit.

| Property | Value |
|---|---|
| Spatial extent | [-180, -84, 180, 84] |
| Temporal extent | 2015/06/23 - Current |
| DOI | 10.71570/y2z3-0g24 |
Sentinel-2 Top of Canopy (TOC) Products (tiles) - V2
Sentinel-2 L2A atmospheric corrected Top-Of-Canopy (TOC) products V2.
| Property | Value |
|---|---|
| Spatial extent | [-180, -84, 180, 84] |
| Temporal extent | 2015/06/23 - Current |
| DOI | 10.71570/6s1a-eq03 |
The Algorithm Theoretical Basis Document (ATBD) for this collection can be found here.
Vegetation
Sentinel-2 Canopy Chlorophyll Content (CCC) (tiles) - V2
The Sentinel-2 CCC corresponds to the Canopy Chlorophyll Content.

| Property | Value |
|---|---|
| Spatial extent | [-180, -84, 180, 84] |
| Temporal extent | 2015/06/23 - Current |
| DOI | 10.71570/v200-df95 |
The Algorithm Theoretical Basis Document (ATBD) for this collection can be found here.
Sentinel-2 Canopy Water Content (CWC) (tiles) - V2
The Sentinel-2 CWC corresponds to the Canopy Water Content.

| Property | Value |
|---|---|
| Spatial extent | [-180, -84, 180, 84] |
| Temporal extent | 2015/06/23 - Current |
| DOI | 10.71570/cmjx-2b30 |
The Algorithm Theoretical Basis Document (ATBD) for this collection can be found here.
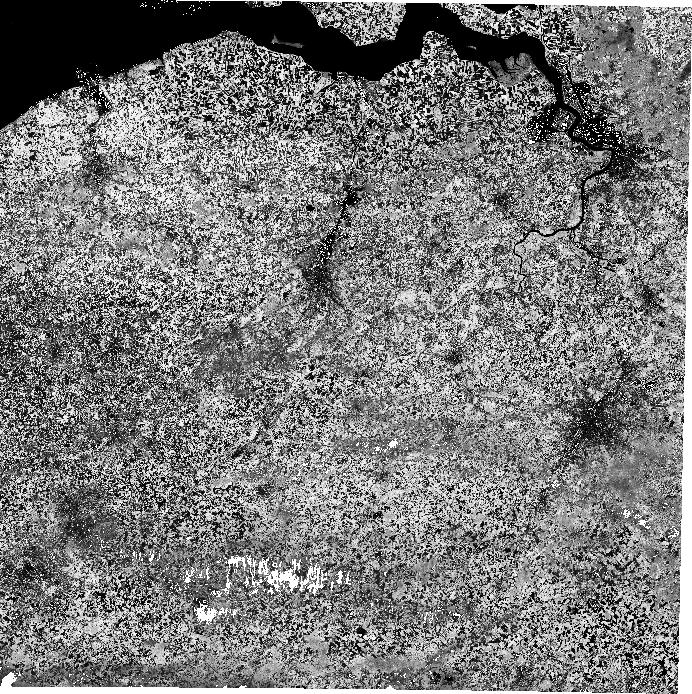
Sentinel-2 Fraction of Absorbed Photosynthetically Active Radiation (FAPAR) (tiles) - V2
FAPAR corresponds to the fraction of photosynthetically active radiation absorbed by the canopy. The FAPAR value results directly from the radiative transfer model in the canopy which is computed instantaneously. It depends on canopy structure, vegetation element optical properties and illumination conditions. FAPAR is very useful as input to a number of primary productivity models which run at the daily time step. Consequently, the product definition should correspond to the daily integrated FAPAR value that can be approached by computation of the clear sky daily integrated FAPAR values as well as the FAPAR value computed for diffuse conditions. The SENTINEL 2 FAPAR product corresponds to the instantaneous black-sky around 10:15 which is a close approximation of the daily integrated black-sky FAPAR value. The FAPAR refers only to the green parts of the canopy.FAPAR corresponds to the fraction of photosynthetically active radiation absorbed by the canopy.The FAPAR value results directly from the radiative transfer model in the canopy which is computed instantaneously. It depends on canopy structure, vegetation element optical properties and illumination conditions. FAPAR is very useful as input to a number of primary productivity models which run at the daily time step. Consequently, the product definition should correspond to the daily integrated FAPAR value that can be approached by computation of the clear sky daily integrated FAPAR values as well as the FAPAR value computed for diffuse conditions. The SENTINEL 2 FAPAR product corresponds to the instantaneous black-sky around 10:15 which is a close approximation of the daily integrated black-sky FAPAR value. The FAPAR refers only to the green parts of the canopy.
| Property | Value |
|---|---|
| Spatial extent | [-180, -84, 180, 84] |
| Temporal extent | 2015/06/23 - Current |
| DOI | 10.71570/pzhz-8a08 |
The Algorithm Theoretical Basis Document (ATBD) for this collection can be found here.
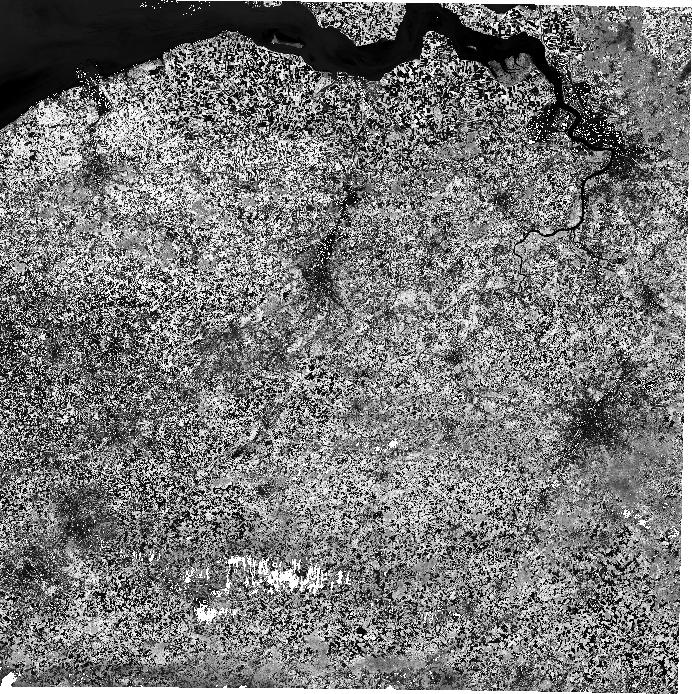
Sentinel-2 Fraction of Vegetation Cover (FCOVER) (tiles) - V2
Fraction of vegetation Cover (FCOVER) corresponds to the gap fraction for nadir direction. It is used to separate vegetation and soil in energy balance processes, including temperature and evapotranspiration. It is computed from the leaf area index and other canopy structural variables and does not depend on variables such as the geometry of illumination as compared to FAPAR. For this reason, it is a very good candidate for the replacement of classical vegetation indices for the monitoring of green vegetation. Because of the linear relationship with radiometric signal, FCOVER will be only marginally scale dependent. Note that similarly to LAI and FAPAR, only the green elements will be considered, either belonging both to the overstorey and understorey.
| Property | Value |
|---|---|
| Spatial extent | [-180, -84, 180, 84] |
| Temporal extent | 2015/06/23 - Current |
| DOI | 10.71570/qcms-0348 |
The Algorithm Theoretical Basis Document (ATBD) for this collection can be found here.
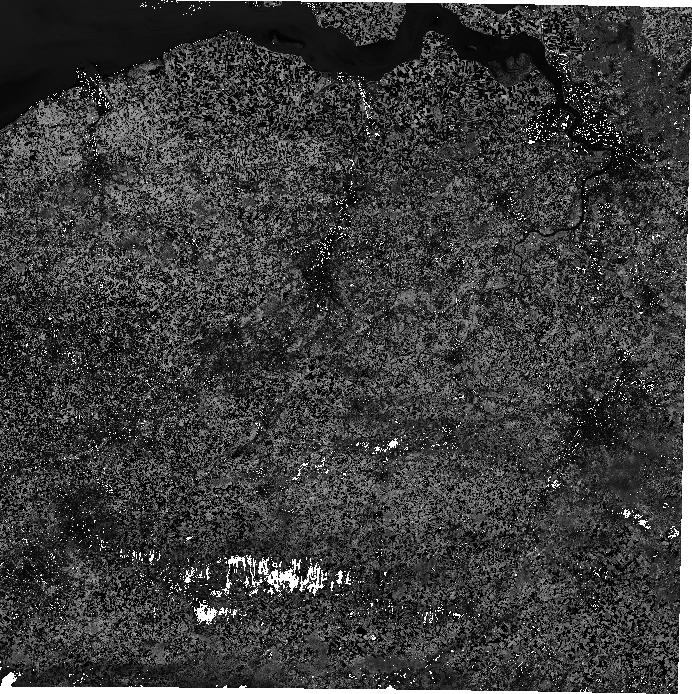
Sentinel-2 Leaf Area Index (LAI) (tiles) - V2
LAI was defined by Committee of the Earth Observation System (CEOS) as half the developed area of the convex hull wrapping the green canopy elements per unit horizontal ground. This definition allows accounting for elements which are not flat such as needles or stems. LAI is strongly non linearly related to reflectance. Therefore, its estimation from remote sensing observations will be scale dependant over heterogeneous landscapes. When observing a canopy made of different layers of vegetation, it is therefore mandatory to consider all the green layers. This is particularly important for forest canopies where the understory may represent a very significant contribution to the total canopy LAI. The derived LAI corresponds therefore to the total green LAI, including the contribution of the green elements of the understory. The resulting SENTNEL LAI products are relatively consistent with the actual LAI for low LAI values and ‘non-forest’ surfaces; while for forests, particularly for needle leaf types, significant departures with the true LAI are expected.
| Property | Value |
|---|---|
| Spatial extent | [-180, -84, 180, 84] |
| Temporal extent | 2015/06/23 - Current |
| DOI | 10.71570/4ypx-q945 |
The Algorithm Theoretical Basis Document (ATBD) for this collection can be found here.
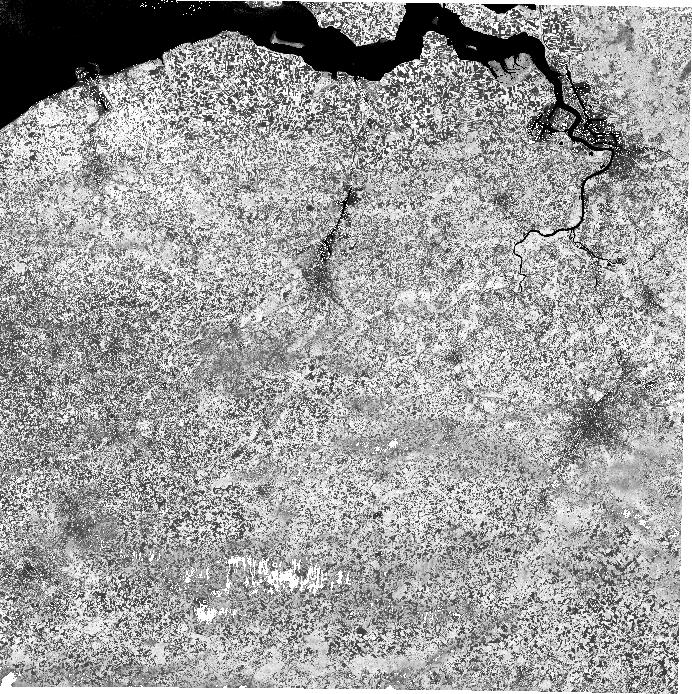
Sentinel-2 Normalized Difference Vegetation Index (NDVI) (tiles) - V2
The Sentinel-2 Normalized Difference Vegetation Index (NDVI) is a proxy to quantify the vegetation amount. It is defined as NDVI=(NIR-Red)/(NIR+Red) where NIR corresponds to the reflectance in the near infrared band , and Red to the reflectance in the red band. It is closely related to FAPAR and is little scale dependant.
| Property | Value |
|---|---|
| Spatial extent | [-180, -84, 180, 84] |
| Temporal extent | 2015/06/23 - Current |
| DOI | 10.71570/hdj5-gd08 |
The Algorithm Theoretical Basis Document (ATBD) for this collection can be found here.
Water
Sentinel-2 Water-Leaving Reflectance (RHOW) (tiles) - V1
L2A atmospheric corrected Water-Leaving reflectance (RHOW) products V1, generated using the iCOR processing tool.
| Property | Value |
|---|---|
| Spatial extent | [-180, -84, 180, 84] |
| Temporal extent | 2015/06/23 - Current |
| DOI | 10.71570/3wds-ja35 |
The Algorithm Theoretical Basis Document (ATBD) for this collection can be found here.
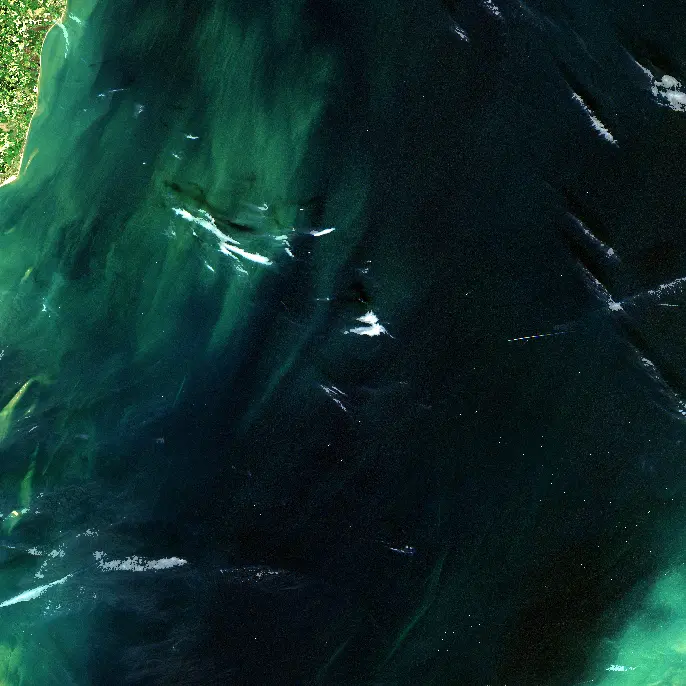
Sentinel-2 Chlorophyll-a (CHL) (tiles) - V1
Chlorophyll-a concentration in inland, transitional and coastal water, generated combing the OC3 algorithm (O’Reilly et al., 1998) and the two-band algorithm from Gilerson et al. (2010). The OC3 algorithm is used by default, except in turbid productive inland and coastal waters where its performance is poor. In those cases the workflow switches to Gilerson et al. (2010). This switching occurs at pixel level, which might cause small artefacts. Chlorophyll-a concentrations can range from 0 mg m-3 up till 1000 mg m-3 in high abundance of harmful algae blooms (Schallens, 2006). Land and clouds are masked.
| Property | Value |
|---|---|
| Spatial extent | [-180, -84, 180, 84] |
| Temporal extent | 2015/06/23 - Current |
| DOI | 10.71570/y10q-f914 |
The Algorithm Theoretical Basis Document (ATBD) for this collection can be found here.
Sentinel-2 Suspended Particulate Matter (SPM) (tiles) - V1
Suspended particulate matter concentration in inland, coastal and transitional waters generated using a switching version of the semi-empirical single-band Nechad et al.(2010) algorithm. The algorithm switches between bands in function of the derived SPM concentrations. Lower wavelengths are more sensitive to small changes in low SPM concentration, but rapidly saturates with high SPM concentrations. Longer wavelengths saturate less at high SPM concentration, but are less sensitive for the low SPM concentrations. B04 (665 nm) is used for concentrations up till 50 g m-3 and B08 (865 nm) for concentrations > 150 g m-3. In between a weighted average of both bands is calculated. Land and clouds are masked.
| Property | Value |
|---|---|
| Spatial extent | [-180, -84, 180, 84] |
| Temporal extent | 2015/06/23 - Current |
| DOI | 10.71570/vrw1-8313 |
The Algorithm Theoretical Basis Document (ATBD) for this collection can be found here.
Sentinel-2 Turbidity (TUR) (tiles) - V1
Turbidity in inland, coastal and transitional waters, generated using a switching version of the semi-empirical single-band Nechad et al. (2009) approach. The algorithm switches between bands in function of the derived turbidity values. Lower wavelengths are more sensitive to small changes in the low turbidity range, but rapidly saturates with high turbidity. Longer wavelengths saturate less at high turbidity values, but are less sensitive for the low turbidity. B04 (665 nm) is used for turbidity levels up till 50 FNU and B08 (865 nm) for concentrations > 150 FNU. In between a weighted average of both bands is calculated. Land and clouds are masked.

| Property | Value |
|---|---|
| Spatial extent | [-180, -84, 180, 84] |
| Temporal extent | 2015/06/23 - Current |
| DOI | 10.71570/h7nn-dj93 |
The Algorithm Theoretical Basis Document (ATBD) for this collection can be found here.