CropSAR Service
CropSAR utilizes Sentinel-1 radar observations alongside Sentinel-2 data. It enables continuous monitoring of vegetation properties. This approach includes vegetation information for locations obscured by clouds for Sentinel-2 data. It benefits operational agricultural monitoring, allowing observation of the entire crop growth cycle, including critical developmental changes.
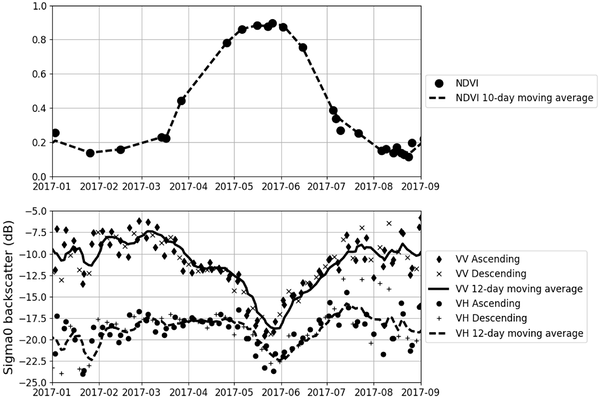
The Sentinel-1 \(\sigma\)0 backscatter signal provides insights into vegetation structure and soil moisture content. Figure 1 illustrates this correlation.
For a more detailed introduction to CropSAR, including its working principles and added value, refer to this blog.
CropSAR aims to deliver augmented Sentinel-1 and Sentinel-2 vegetation indices tailored for individual agricultural fields. While it can be requested for larger areas, its added value may be limited. Additionally, processing time for generating results at this scale can be significant.
Use the CropSAR Service
While detailed API documentation for the CropSAR webservice is available here, the following examples demonstrate how to use the CropSAR service in Python. User can directly access the CropSAR to run it in a openEO web editor.
Using as EOplaza Service
An example of accessing the CropSAR service for FAPAR is shown below; for a detailed explanation of using the EOplaza service, refer to the page here.
# import necessary packages
import openeo

# connect with the backend
eoconn = openeo.connect(
        "openeo.vito.be"
        ).authenticate_oidc()

# Setup process parameters
aoi = {
        "type": "Polygon",
        "coordinates": [
          [
            [
              5.179324150085449,
              51.2498689148547
            ],
            [
              5.178744792938232,
              51.24672597710759
            ],
            [
              5.185289382934569,
              51.24504696935156
            ],
            [
              5.18676996231079,
              51.245342479161295
            ],
            [
              5.187370777130127,
              51.24918393390799
            ],
            [
              5.179324150085449,
              51.2498689148547
            ]
          ]
        ]
      }
date = "2021-10-01", "2021-10-10"

# Define the biophysical parameter such as FAPAR, FCOVER etc
biopar = "FAPAR"

# Create a processing graph from the CropSAR process using an active openEO connection
cropsar = eoconn.datacube_from_process(
          "CropSAR",
          namespace="vito",
          polygon=aoi,
          date=date,
          biopar_type=biopar
          )

# Execute the process graph
cropsar.download("Fapar.json")
Using requests module
The following example retrieves a basic CropSAR timeseries for fAPAR:
import requests

geometry = {
    "type": "Polygon",
    "coordinates": [[
        [5.1033251301854055, 51.28261016933643],
        [5.1031970304595395, 51.28309115665867],
        [5.104381444596166,  51.283690689238],
        [5.103852870907387,  51.28270508250087],
        [5.1033251301854055, 51.28261016933643]
    ]]
}

response = requests.post(url='https://cropsar.vito.be/api/v1.0/cropsar/',
                         params={'product': 'S2_FAPAR',
                                 'start':   '2019-01-01',
                                 'end':     '2019-12-31',
                                 'crs':     'epsg:4326',
                                 'source':  'probav-mep'},
                         json=geometry)

response.raise_for_status()

data = response.json()

import pandas

df = pandas.DataFrame.from_dict(data, orient='index')
df.index = pandas.to_datetime(df.index)
df.data = pandas.to_numeric(df.data, errors='coerce')
df.plot(figsize=(10, 5))
df
User can use either of the above methods to access the CropSAR service.