Terrascope Viewer
The Terrascope Viewer is a web-based application that allows users to explore and visualize various datasets offered by Terrascope. Designed to be user-friendly and accessible to individuals with varying levels of expertise, it is an ideal tool for exploring and analyzing geospatial data. Users can visualize the data, download, export, and compare two images. This document provides an overview of the Terrascope Viewer and its main components.
Overview
TThe viewer can be accessed at viewer.terrascope.be. When users first open this link, they see the interface shown in the image below:
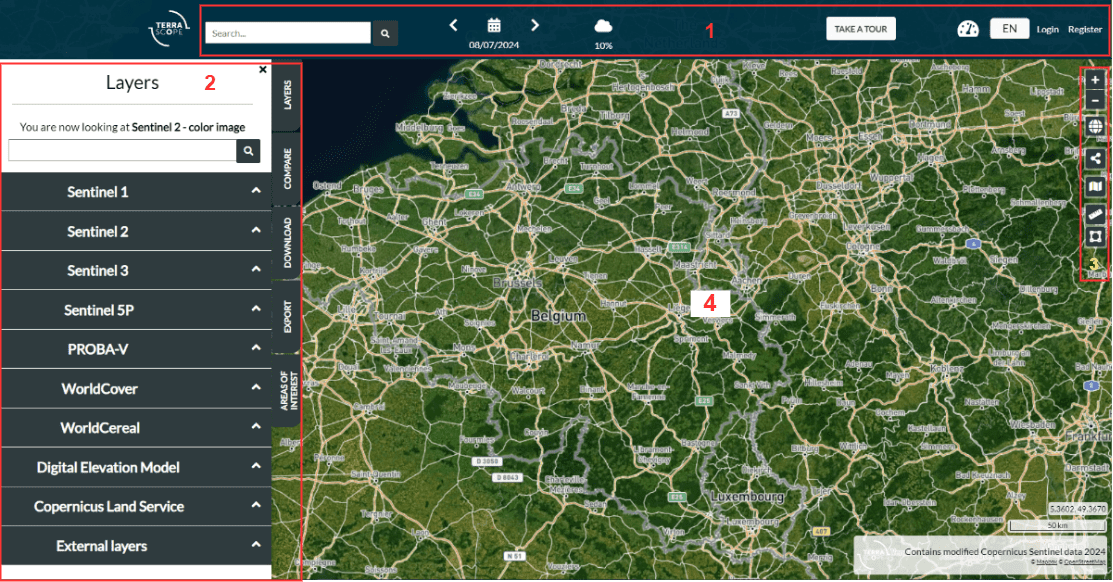
Visitors are greeted with a guided tour that introduces the main features and functionalities of the viewer. Here is a brief overview of the main components of the viewer:
- Navbar: The navbar contains the following elements:
- Terrascope logo
- Search bar: Users can search for specific locations using the search bar.
- Calendar: The calendar suggests the data availability on different dates.
- Cloud percentage: Users can select the cloud percentage for the selected dataset.
- Take a tour: Users can click on this button to embark on a guided tour of the viewer.
- Dashboard: The dashboard shows the performance status of supported web services.
- Language selection: The user can select among the available languages(currently EN, FR and NL).
- Login: If the user has an account, they can log in using this button.
- Register: If the user does not have an account, they can register using this button.
- Sidebar: The sidebar contains the following elements:
- Layers: Users can select the dataset provided by Terrascope from the Layer tab. Please note that only one dataset can be selected at a time.
- Compare: The sidebar collapses once the “Compare” tab is selected. This provides the user with a larger viewing area to view two datasets. Additionally, users can compare the same dataset for two different dates.
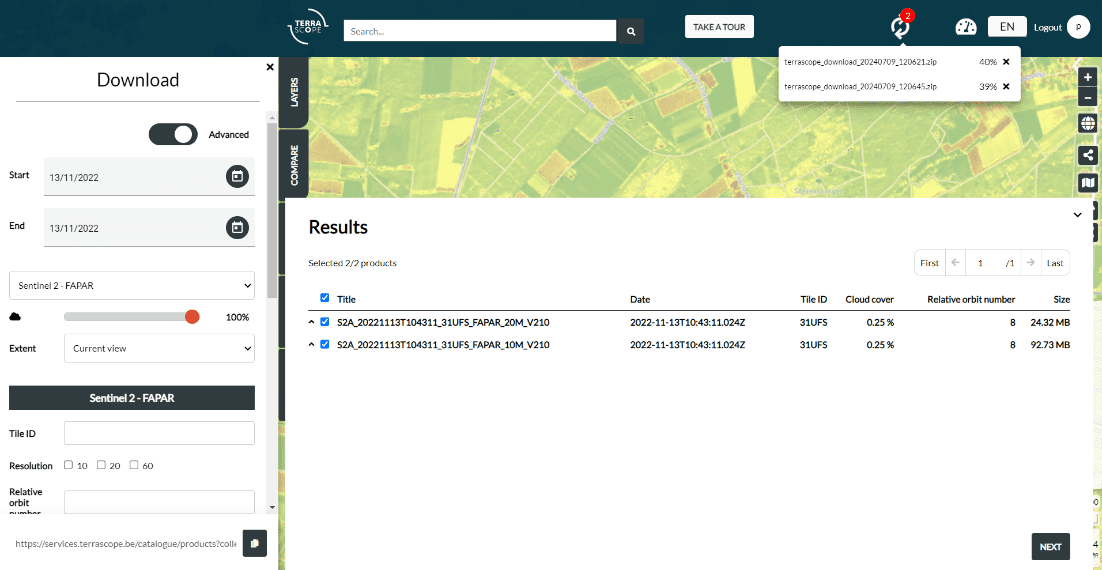
- Download: After zooming in to the desired location, users can download the image by clicking the “Download” tab. Users can specify the image settings within the tab or even search for a specific tile by its ID. Once the image is selected on the screen, the user can click the “Next” button to download. This leads to a window showing the list of products and a Download overview.
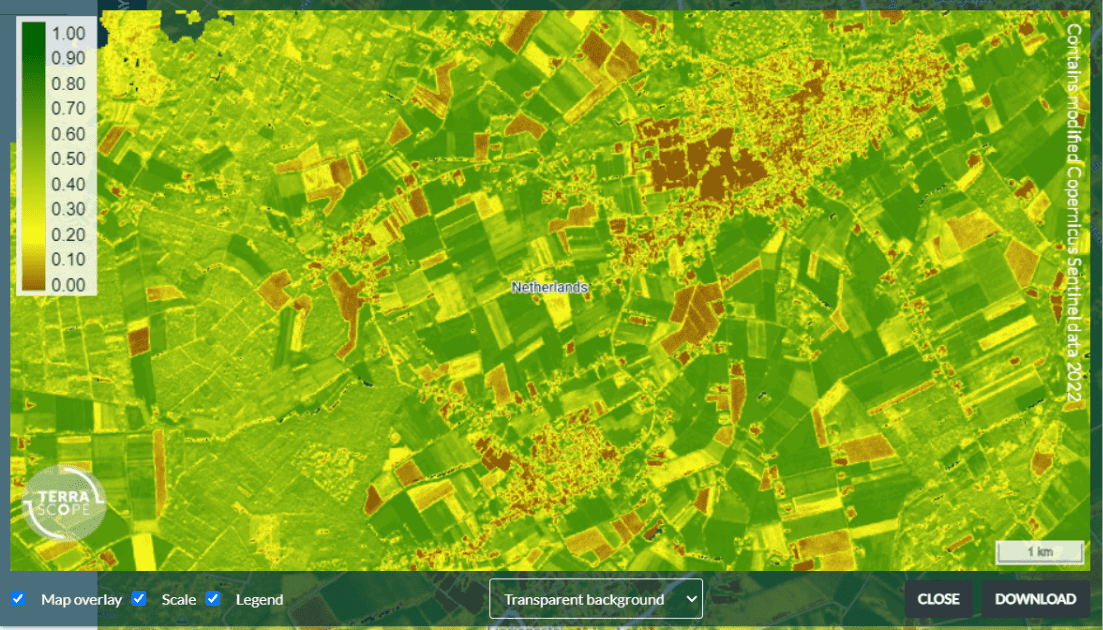
- Export: From the “Export” tab, the user can export the image as a PNG or GIF file. The GIF file can create a time-lapse of the selected area.
- Area of Interest: Users can draw a polygon on the map to select a specific area of interest. Additionally, municipalities can be selected from the dropdown list for the region of Belgium. There is an option to import or export the area of interest as a .shp and .prj file, .kml file or a zip file.
- Tool-set: The tool set contains the following elements:
- Zoom in: Users can zoom in to the desired location by clicking the “+” button.
- Zoom out: Users can zoom out by clicking the “-” button.
- Globe: Users can view the globe by clicking the “Globe” button.
- Draw: Users can draw a polygon on the map by clicking the “Draw” button.
- Share: A link to the current view can be shared by clicking the “Share” button.
- Basemap: Users can select the basemap as either “Satellite” or “OpenStreetMap”. Furthermore, they can overlay the base map with street layers or administrative boundaries (applicable only to Belgium).
- Measure distance and area: Two options are available for measuring distance and area. Users can select the “Distance” or “Area” option to measure the distance or area respectively. Once the option is selected, the user can click on the map to start measuring. The measurements are then displayed on the map.
- Map: The window previews the selected dataset for the area of interest. Users can visualise the image tiles, dataset layers, and other information on the map.
Visualizing available collections
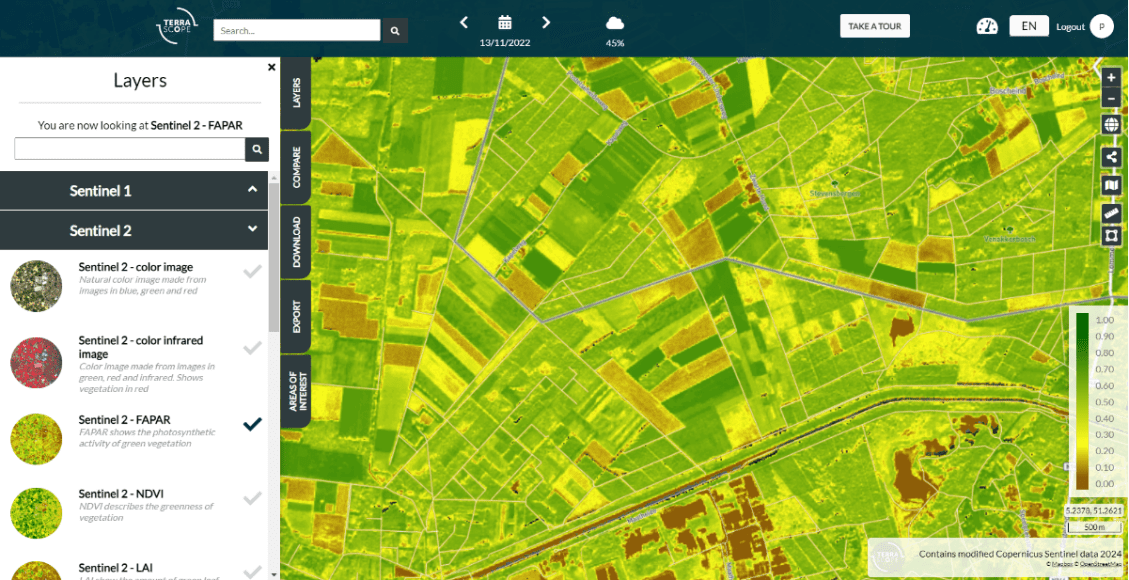
The viewer provides access to various datasets offered by Terrascope. Users can select the desired dataset from the “Layers” tab in the sidebar. The basic steps to visualize a dataset are as follows:
- Zoom to the area of interest or upload the area of interest. Optionally, select the attributes to fill in AOI information, such as area, etc.
- Select among the available datasets from the “Layers” tab in the sidebar.
Download images
Users can download the image once the layer is selected by clicking the “Download” tab in the sidebar. In addition to the download option, an OpenSearch link is available to access the dataset programmatically or integrate it into other applications.
Once the user clicks on the “Next” button to proceed with the download, a window showing the list of products and the download overview will appear. The user can select the desired product and click the “Download” button to download the image as a zip file containing the image in GeoTIFF format.
Export image and time lapse
An image can be exported as a PNG file with the legends and scale bar. However, users can choose to remove these details from the image based on preferences.
Additionally, users can export a time-lapse of the selected area. Under the “Export” tab, the user can choose the time-lapse’s desired time range and interval. Similar options for exporting a single image are available for the time-lapse, including displaying legends and a scale bar.
Compare two images
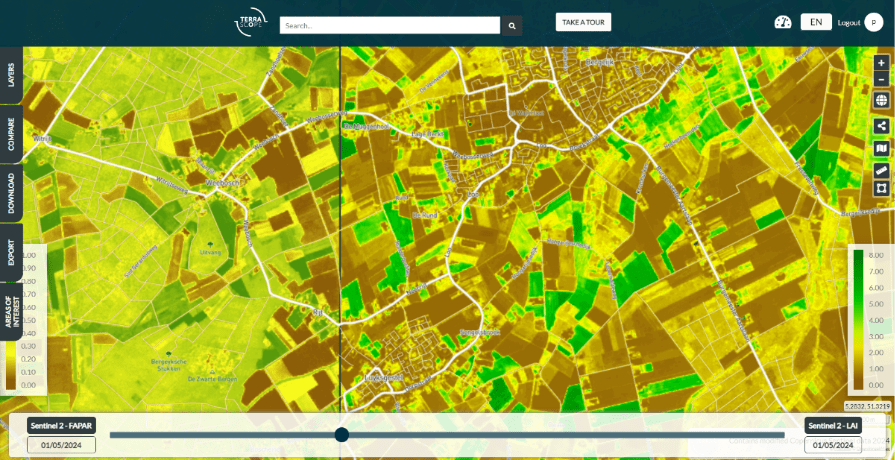
The viewer lets users compare two images in the “Compare” tab. For example, the user can compare FAPAR with LAI for the exact location and date. A scroll bar is provided at the bottom of the screen to move the images horizontally. The date and cloud percentage can be modified from the calendar in the image below.
Here, we provide a brief overview of the Terrascope Viewer. However, we encourage users to explore the viewer and its functionalities to better understand the tool. If you have any questions or need further support, contact us via TerraScope Forum or send a mail to eoplaza@terrascope.be.