Accessing Spark logs
Access to Spark logs is available for monitoring and troubleshooting Spark jobs. This page provides instructions for accessing Spark logs using the YARN ResourceManager UI and the yarn logs command. The YARN ResourceManager UI and the yarn logs command can only be used from the User Virtual Machine.
New Hadoop Cluster
For the new Hadoop cluster, use the following endpoints:
- YARN ResourceManager UI: https://master-01.hadoop.rscluster.vito.be:8090/cluster
- Spark History Server: https://history.hadoop.rscluster.vito.be:18481
YARN ResourceManager UI
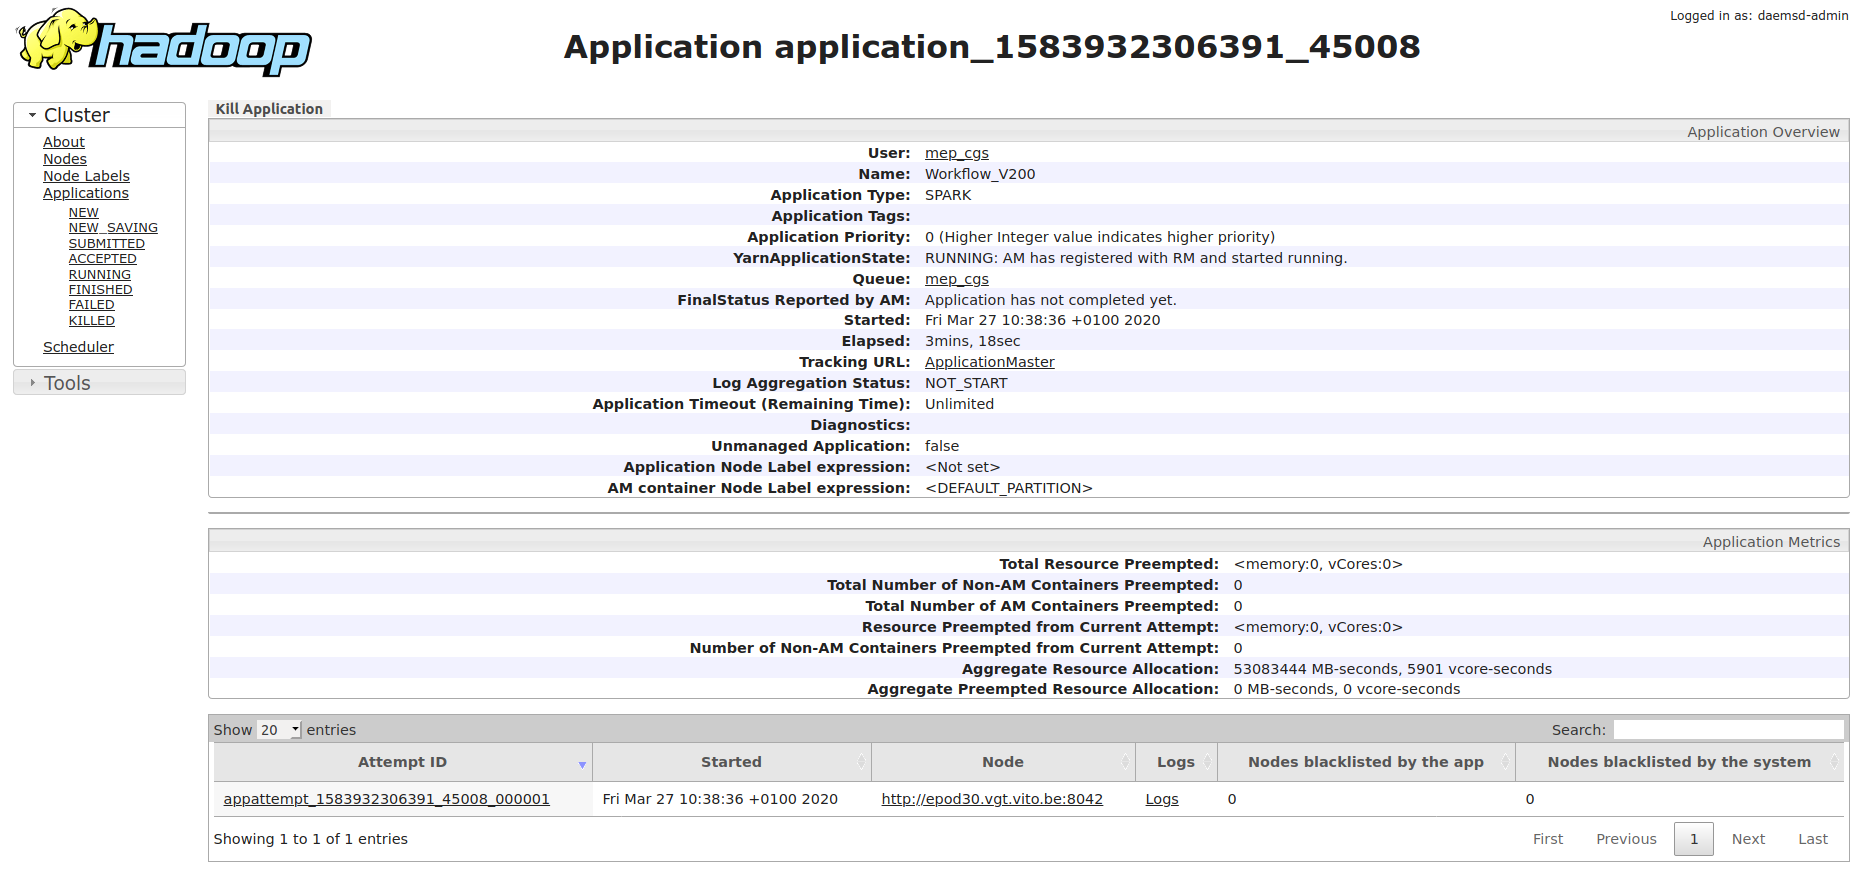
The YARN ResourceManager UI provides access to the Spark UI, which contains detailed information about the Spark job, including the DAG visualization, job statistics, and logs.
Access the Spark UI by clicking the ApplicationMaster link in the YARN ResourceManager UI.
For the new cluster, access the YARN ResourceManager UI at https://master-01.hadoop.rscluster.vito.be:8090/cluster:
- Use a Firefox web browser from the User Virtual Machine.
- Have a valid Ticket Granting Ticket (TGT); instructions for creating a TGT can be found in Advanced Kerberos.
- Once in the UI, select an application ID to view the details of an application and click on the ApplicationMaster link to get to the Spark UI.

Spark History Server
The Spark History Server provides access to historical information about completed Spark applications. This is particularly useful for analyzing past job executions, viewing detailed metrics, and troubleshooting issues after a job has finished.
For the new cluster, access the Spark History Server at https://history.hadoop.rscluster.vito.be:18481:
- Use a Firefox web browser from the User Virtual Machine.
- Have a valid Ticket Granting Ticket (TGT); instructions for creating a TGT can be found in Advanced Kerberos.
- The Spark History Server displays a list of completed applications, allowing you to browse job details, view execution plans, examine stage and task information, and access application logs.
The Spark History Server is especially valuable for:
- Reviewing job performance metrics and resource utilization
- Analyzing execution plans and understanding data flow
- Accessing logs from completed applications
- Comparing performance across different job runs
YARN logs command
The YARN logs command can retrieve logs for a specific application ID. The application ID can be found in the YARN ResourceManager UI.
To get the logs, use the yarn logs command:
yarn logs -applicationId <application_id>
You can also pipe the output to less to enable scrolling:
yarn logs -applicationId <application_id> | lessThe yarn logs command will output logs for different log types:
stdout: application logs printed tostdoutstderr: application logs printed tostderrdirectory.info: prints the content of the container working directoryprelaunch.out,prelaunch.err,launch_container.sh: logs related to container start
Filter log types by adding the -log_files_pattern parameter, for example:
yarn logs -applicationId <application_id> -log_files_pattern stderr | lessYARN Spark Access Control Lists (ACLs)
To allow other users or user groups to view Spark job logs they didn’t submit themselves (e.g. when running the Spark job as a service user), add the following configuration parameters to spark-submit:
These parameters set permissions for viewing logs of running and finished jobs, as well as modifying (including killing) the submitted job.
--conf spark.ui.view.acls=user1,user2 \
--conf spark.ui.view.acls.groups=group1 \

--conf spark.modify.acls=user1,user2
--conf spark.modify.acls.groups=group1